LazProfiler
From Lazarus wiki
Jump to navigationJump to searchAbout
LazProfiler is an IDE addon which adds a One-Click-Profiler to Lazarus.
Screenshot

Download
- It's available through Online Package Manager (not yet).
System Requirements / Dependencies
- FPC trunk (needs generics)
- Lazarus trunk (revision 56254 and above)
Installation
- Use Online Package Manager (not yet)
Support page
needs to be set up
Using LazProfiler
Start profiling
- Open your project (if not done already)
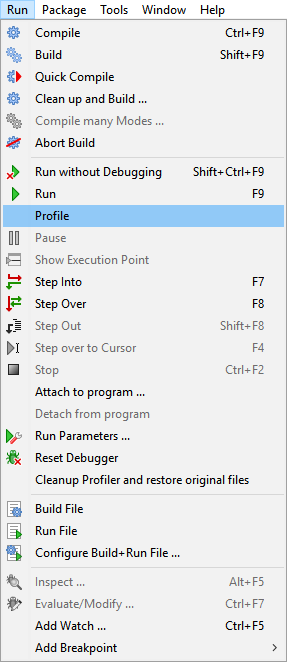
- Choose Profile from Run menu:
- Use your program
- Close your program
- study LazProfiler output:
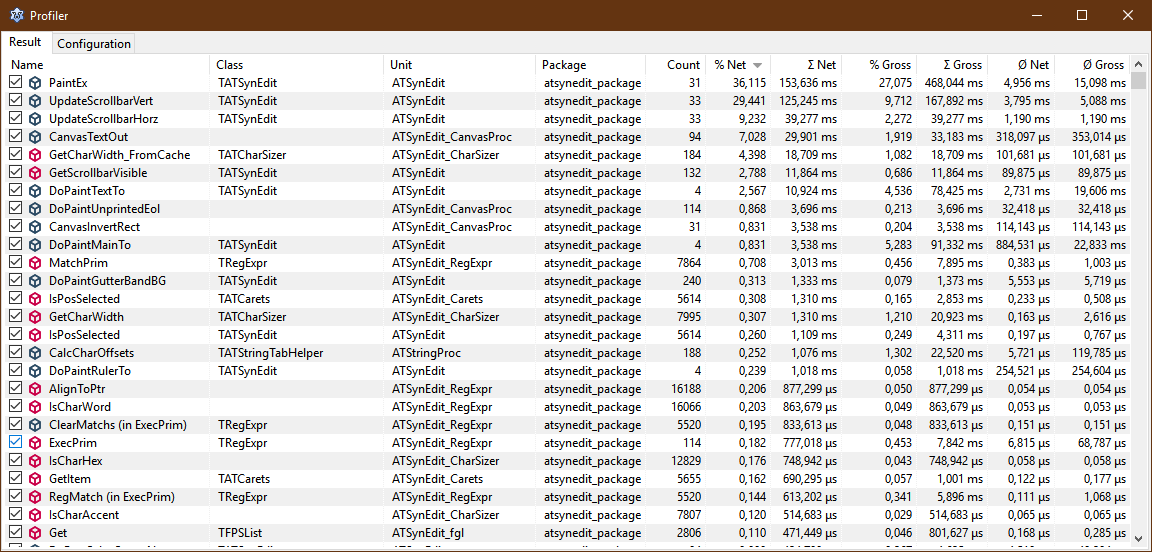

Show output
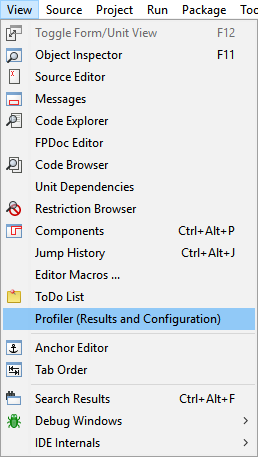
- Choose Profiler from View menu:

Cleanup profiler
In case the instrumenting of the sources produce not compileable code
you can reset the profiler and tidy things up by choosing
Cleanup Profiler from Run menu:
Influencing profiling
Hints in source code
By default the profiling automatically starts.
If you just want to profile some parts of your code
you can surround it by two comments:
// start-profiler
code_to_profile;
// stop-profiler
Disable instrumenting
If you want to exclude procedures/functions from beeing instrumented,
just uncheck the checkbox in front of the procedure/function name
in the profiler output window.

Known issues
- Profiling does not stop counting at ShowModal, ShowMessage, ...