Difference between revisions of "TAChart Tutorial: Chart Tools"
m (Perparations --> Preparation) |
(Chapter on chart tools started) |
||
| Line 1: | Line 1: | ||
== Introduction == | == Introduction == | ||
| − | Charts are powerful to display relationships between data. They get even more powerful if the user can interact with them, for example by zooming into a crowded series to display more details, by panning the visible viewport to other features, by reading values from the series or by measuring characteristic parameters of the plot. | + | Charts are powerful to display relationships between data. They get even more powerful if the user can interact with them, for example |
| + | * by zooming into a crowded series to display more details, | ||
| + | * by panning the visible viewport to other features, | ||
| + | * by reading values from the series or by measuring characteristic parameters of the plot. | ||
The TAChart package is equipped with a powerful collection of tools to help creating interactive charts. In this tutorial, we want to show how to apply zooming and panning in your own programs, in another tutorial we will focus on data tools to analyze data interactively. | The TAChart package is equipped with a powerful collection of tools to help creating interactive charts. In this tutorial, we want to show how to apply zooming and panning in your own programs, in another tutorial we will focus on data tools to analyze data interactively. | ||
| Line 13: | Line 16: | ||
[[file:tachart_getting_started_step6.png]] | [[file:tachart_getting_started_step6.png]] | ||
| − | == | + | == Zooming and Panning - the easy way == |
| − | === Zooming | + | === Zooming === |
Zooming is very easy - you don't have to do anything to implement it since it is built into the heart of the chart component. You just have to drag a rectangle with the left mouse button down around the feature of interest that you want to see in detail. However, you should keep in mind that you have to drag the mouse from the top-left to the right-bottom corner of the rectangle to get the zoom effect. After you release the mouse button, the region is blown up to fill the entire chart. Easy. | Zooming is very easy - you don't have to do anything to implement it since it is built into the heart of the chart component. You just have to drag a rectangle with the left mouse button down around the feature of interest that you want to see in detail. However, you should keep in mind that you have to drag the mouse from the top-left to the right-bottom corner of the rectangle to get the zoom effect. After you release the mouse button, the region is blown up to fill the entire chart. Easy. | ||
| Line 25: | Line 28: | ||
Maybe, for some reason, you do not like this behavior. <code>TChart</code> has a property <code>AllowZoom</code> with which you can turn off the zooming capability. Beyond that, there is nothing else to control the default zooming action. But don't give up: A bit further down we will discuss the ChartTools, and they give you almost unlimited access to any interactive feature. | Maybe, for some reason, you do not like this behavior. <code>TChart</code> has a property <code>AllowZoom</code> with which you can turn off the zooming capability. Beyond that, there is nothing else to control the default zooming action. But don't give up: A bit further down we will discuss the ChartTools, and they give you almost unlimited access to any interactive feature. | ||
| − | === Panning | + | === Panning === |
After you have zoomed into a chart you may want to shift the viewport a bit to find a better view. This operation is called "panning". Unfortunately, the released version of Lazarus (v1.0) does not have built-in panning capabilities. Only recently a default panning operation has been introduced into the trunk version of Lazarus. For this purpose, you hold down the right mouse button, the cursor transforms into a 4-arrow-shape to indicate that you can move the viewport around by dragging. | After you have zoomed into a chart you may want to shift the viewport a bit to find a better view. This operation is called "panning". Unfortunately, the released version of Lazarus (v1.0) does not have built-in panning capabilities. Only recently a default panning operation has been introduced into the trunk version of Lazarus. For this purpose, you hold down the right mouse button, the cursor transforms into a 4-arrow-shape to indicate that you can move the viewport around by dragging. | ||
| Line 34: | Line 37: | ||
TChart currently does not have a property <code>AllowPan</code> to turn off panning. As we will see shortly, panning can be turned off also with ChartTools, so this is no real disadvantage. | TChart currently does not have a property <code>AllowPan</code> to turn off panning. As we will see shortly, panning can be turned off also with ChartTools, so this is no real disadvantage. | ||
| − | == Using | + | == Using chart tools == |
=== Basics === | === Basics === | ||
| + | As you have seen, to add zooming and panning capabilities to your program can't be easier -- there's nothing to do, they are already there. But on the other hand, usage of the built-in routines is quite limited: zooming is only possible by using the left mouse button, panning by using the right mouse button; no mouse-wheel support; no vertical-only or horizontal-only zooming; no reading of data values, etc. | ||
| + | |||
| + | For more versatile user interaction a set of [[TAChart_documentation#Tools|chart tools]] has been added to TAChart. All these tools inherit from <code>TChartTool</code> (there is another ancestor down along the hierarchy, <code>TBasicChartTools</code>, but this is not important here). Each tool is specialized to some specific action. There are two types of tools: [[TAChart_documentation#Extent_tools|Extent tools]] and [[TAChart_documentation#Data_tools|data tools]]. | ||
| + | * [[TAChart_documentation#Extent_tools|'''Extent tools''']] modifiy the '''extent''' of the chart -- this is the visible viewport -- i.e. they are responsible for zooming and panning. | ||
| + | ** for '''zooming''': | ||
| + | *** [[TAChart_documentation#Zoom_drag_tool|TZoomDragTool]] allows zooming by dragging the mouse, just as was described above, but now with access to many parameters to adjust the behavior | ||
| + | *** [[TAChart_documentation#Zoom_click_tool|TZoomClickTool]] zooms by a predefined factor after clicking with the mouse. | ||
| + | *** [[TAChart_documentation#Zoom_mouse-wheel_tool|TZoomMouseWheelTool]] allows zooming by rotating the mouse wheel. | ||
| + | ** for '''unzooming''': | ||
| + | *** there are no dedicated tools for unzooming, this feature is built into the tools used for zooming. For unzooming, you usually invert the parameter that defines the amount of zooming. | ||
| + | ** for '''panning''': | ||
| + | *** [[TAChart_documentation#Pan_drag_tool|TPanDragTool]] is specialized for panning the visible viewport by dragging with the mouse, as described above. | ||
| + | *** [[TAChart_documentation#Pan_click_tool|TPanClickTool]] allows to pan by clicking the mouse near the edge of the chart. Panning goes into the direction of that edge. | ||
| + | *** [[TAChart_documentation#Pan_mouse_wheel_tool|TPanMouseWheelTool]] is for panning by rotating the mouse wheel. | ||
| + | * [[TAChart_documentation#Data_tools|'''Data tools''']] give interactive access to data displayed in the series, or even allow to modify the data: | ||
| + | ** [[TAChart_documentation#Data_point_click_tool|TDataPointClickTool]] identifies the data point and series onto which the mouse is clicked. | ||
| + | ** [[TAChart_documentation#Data_point_drag_tool|TDataPointDragTool]] allows to drag a data point by means of the mouse | ||
| + | ** [[TAChart_documentation#Data_point_hint_tool|TDataPointHintTool]] displays a hovering hint windows when the mouse is close enough to a data point | ||
| + | ** [[TAChart_documentation#Data_point_crosshair_tool|TDataPointCrosshairTool]] displays a crosshair when the mouse is sufficiently close to a data point: | ||
| + | ** [[TAChart_documentation#Data_point_distance_tool|TDataPointDistanceTool]] allows to measure the distance between data points. | ||
| + | * and, if nothing else fits your needs, [[TAChart_documentation#User_defined_tool|TUserDefinedTool]] allows you to build your own tool according to your specific needs. | ||
| + | |||
=== Tools for zooming === | === Tools for zooming === | ||
=== Tools for panning === | === Tools for panning === | ||
Revision as of 09:37, 4 October 2012
Introduction
Charts are powerful to display relationships between data. They get even more powerful if the user can interact with them, for example
- by zooming into a crowded series to display more details,
- by panning the visible viewport to other features,
- by reading values from the series or by measuring characteristic parameters of the plot.
The TAChart package is equipped with a powerful collection of tools to help creating interactive charts. In this tutorial, we want to show how to apply zooming and panning in your own programs, in another tutorial we will focus on data tools to analyze data interactively.
If you are not familiar with TAChart we recommend that you have a look at the Getting started tutorial. Of course, you must have some experience with Lazarus and FPC.
ChartTools have made some progress after the official version 1.0 of Lazarus has been released. Therefore, it may be advantageous to use the current trunk version from svn, otherwise some topics of this tutorial will not be available.
Preparation
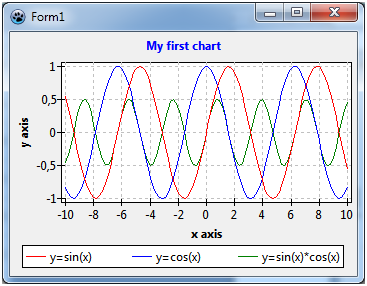
We need a chart to play with. You can use any chart that you ever created for our exercises, but I'll be using here the simple chart of the Getting started tutorial.
Zooming and Panning - the easy way
Zooming
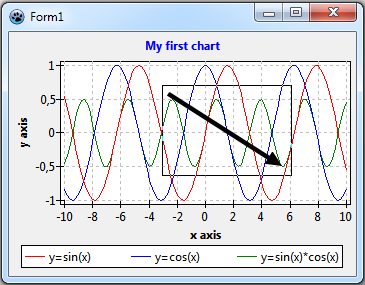
Zooming is very easy - you don't have to do anything to implement it since it is built into the heart of the chart component. You just have to drag a rectangle with the left mouse button down around the feature of interest that you want to see in detail. However, you should keep in mind that you have to drag the mouse from the top-left to the right-bottom corner of the rectangle to get the zoom effect. After you release the mouse button, the region is blown up to fill the entire chart. Easy.
You can repeat this procedure to zoom into the chart deeper and deeper.
If you want to restore the original viewport just click into the chart with the left button, or drag a rectangle in any -- except for the top-left to right-bottom -- direction.
Maybe, for some reason, you do not like this behavior. TChart has a property AllowZoom with which you can turn off the zooming capability. Beyond that, there is nothing else to control the default zooming action. But don't give up: A bit further down we will discuss the ChartTools, and they give you almost unlimited access to any interactive feature.
Panning
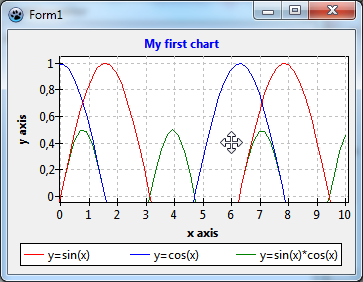
After you have zoomed into a chart you may want to shift the viewport a bit to find a better view. This operation is called "panning". Unfortunately, the released version of Lazarus (v1.0) does not have built-in panning capabilities. Only recently a default panning operation has been introduced into the trunk version of Lazarus. For this purpose, you hold down the right mouse button, the cursor transforms into a 4-arrow-shape to indicate that you can move the viewport around by dragging.
As with zooming you can restore the original viewport by clicking into the chart, or by dragging a rectangle in any direction, except from top-left to bottom-right. Note that you use the left mouse button for "un-panning" although you had used the right button for panning.
TChart currently does not have a property AllowPan to turn off panning. As we will see shortly, panning can be turned off also with ChartTools, so this is no real disadvantage.
Using chart tools
Basics
As you have seen, to add zooming and panning capabilities to your program can't be easier -- there's nothing to do, they are already there. But on the other hand, usage of the built-in routines is quite limited: zooming is only possible by using the left mouse button, panning by using the right mouse button; no mouse-wheel support; no vertical-only or horizontal-only zooming; no reading of data values, etc.
For more versatile user interaction a set of chart tools has been added to TAChart. All these tools inherit from TChartTool (there is another ancestor down along the hierarchy, TBasicChartTools, but this is not important here). Each tool is specialized to some specific action. There are two types of tools: Extent tools and data tools.
- Extent tools modifiy the extent of the chart -- this is the visible viewport -- i.e. they are responsible for zooming and panning.
- for zooming:
- TZoomDragTool allows zooming by dragging the mouse, just as was described above, but now with access to many parameters to adjust the behavior
- TZoomClickTool zooms by a predefined factor after clicking with the mouse.
- TZoomMouseWheelTool allows zooming by rotating the mouse wheel.
- for unzooming:
- there are no dedicated tools for unzooming, this feature is built into the tools used for zooming. For unzooming, you usually invert the parameter that defines the amount of zooming.
- for panning:
- TPanDragTool is specialized for panning the visible viewport by dragging with the mouse, as described above.
- TPanClickTool allows to pan by clicking the mouse near the edge of the chart. Panning goes into the direction of that edge.
- TPanMouseWheelTool is for panning by rotating the mouse wheel.
- for zooming:
- Data tools give interactive access to data displayed in the series, or even allow to modify the data:
- TDataPointClickTool identifies the data point and series onto which the mouse is clicked.
- TDataPointDragTool allows to drag a data point by means of the mouse
- TDataPointHintTool displays a hovering hint windows when the mouse is close enough to a data point
- TDataPointCrosshairTool displays a crosshair when the mouse is sufficiently close to a data point:
- TDataPointDistanceTool allows to measure the distance between data points.
- and, if nothing else fits your needs, TUserDefinedTool allows you to build your own tool according to your specific needs.


