TAChart Tutorial: ColorMapSeries, Zooming
Calculation of the Mandelbrot set
The Mandelbrot set is calculated for each 2d point c = (c.x, c.y) by applying the following recipe:
- Begin by assigning the coordinates of c to another point z = (z.x, z.y) = (c.x, c.y).
- Calculate the "square" of z by means of the following formula: z² = ((z.x)²-(z.y)², 2*(z.x)*(z.y)) (this formula may appear to be a bit strange, but if you are familiar with complex numbers then you will see that it is the square of a complex number). Then add the coordinates of c to those of
z². The result of this step is z² + c - Now take that result and put it into the calculation in step 2 again.
- Repeat this procedure again and again until you can distinguish whether the trace of the movement of the point z in the 2d plane diverges into infinity or not.
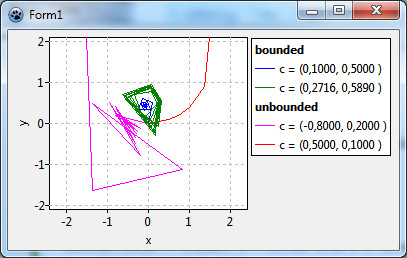
In the figure we show some examples of that trace:
- The red and fuchsia curves eventually move away from the origin, these paths are "unbounded". It can be shown that once the path has crossed a critical distance of 2 from the origin it will never turn back and will escape into infinity. Usually the calculation counts the iterations until the distance from the origin exceeds 2. The number of iterations is mapped to a color which is used to draw the pixel at the starting point.
- The blue path, on the other hand, converges towards the origin. The green curve does not converge, but remains within the escape radius. Therefore, both cases are called "bounded". The iterative calculation would go on forever, therefore it is stopped after a maximum count of iterations. The starting points are said to belong to the Mandelbrot set and are drawn in black color.
Here is the function that we will use to determine whether a point c is in the Mandelbrot set or not. The function result is the iteration count divided by the maximum iteration count. The result 1.0 indicates that c belongs to the Mandelbrot set.
const
  MANDELBROT_NUM_ITERATIONS = 100;
  MANDELBROT_ESCAPE_RADIUS = 2.0;
  MANDELBROT_LIMIT = sqr(MANDELBROT_ESCAPE_RADIUS);

function MandelBrot(c:TDoublePoint): Integer;
var
  iteration: Integer;
  j: Integer;
  z: TDoublePoint;
begin
  Iteration := 0;
  z := DoublePoint(0.0, 0.0);
  for j:=0 to MANDELBROT_NUM_ITERATIONS-1 do begin
    z := DoublePoint(
      sqr(z.X) - sqr(z.Y) + c.X,
      2 * z.X * z.Y + c.Y
    );
    if sqr(z.X) + sqr(z.Y) > MANDELBROT_LIMIT then begin
      Result := Iteration / MANDELBROT_NUM_ITERATIONS;
      exit;
    end;
    inc(Iteration);
  end;
  Result := 1.0;
end;
We will also need a function which maps the result of the Mandelbrot function to a color. A nice color gradient can be obtained by the following procedure which is an interpolation of rgb values applied to two intervals. The input parameter AValue must be number between 0 and 1. (The function InterpolateRGB belongs to the TAChart package and is found in the unit TAChartUtils):
const
  STARTCOLOR = clBlue;
  MIDDLECOLOR = clRed;
  ENDCOLOR = clYellow;
  MIDDLEVALUE = 0.3;

function ValueToColor(AValue: Double; AMiddleValue: Double;
  AStartColor, AMiddleColor, AEndColor: TColor): TColor;
begin
  if AValue < AMiddleValue then
    Result := InterpolateRGB(AStartColor, AMiddleColor,
      AValue/AMiddleValue)
  else
    Result := InterpolateRGB(AMiddleColor, AEndColor,
      (AValue - AMiddleValue) / (1.0 - AMiddleValue)
    );
end;