IDE Window: Watch list
│
Deutsch (de) │
English (en) │
русский (ru) │
Introduction
The *Watches* window is part of the Lazarus debugger.
It displays the values of variables and expressions while an application is paused by the debugger (e.g. at a breakpoint or during stepping).
The watches window can be opened via
- Main Menu > View > Debug Windows > Watches
- Ctrl+Alt+S
- Adding a new watch:
- Ctrl+F5 or Main Menu > Run > Add Watch
- "Add Watch" tool-button in * Evaluate Window and Debug Inspector
Overview
By default there are 2 columns in the watches Window.
- On the left side the "Expression" shows the name of the variable for which data should be shown.
This can also be an expression containing multiple variables, operators, index access and more. - On the right site the current value of the variable or expression is displayed.
The display format depends on the value and can be refined in the "#Watch Properties" dialog.
Additional details can be enabled using the #Toolbar.
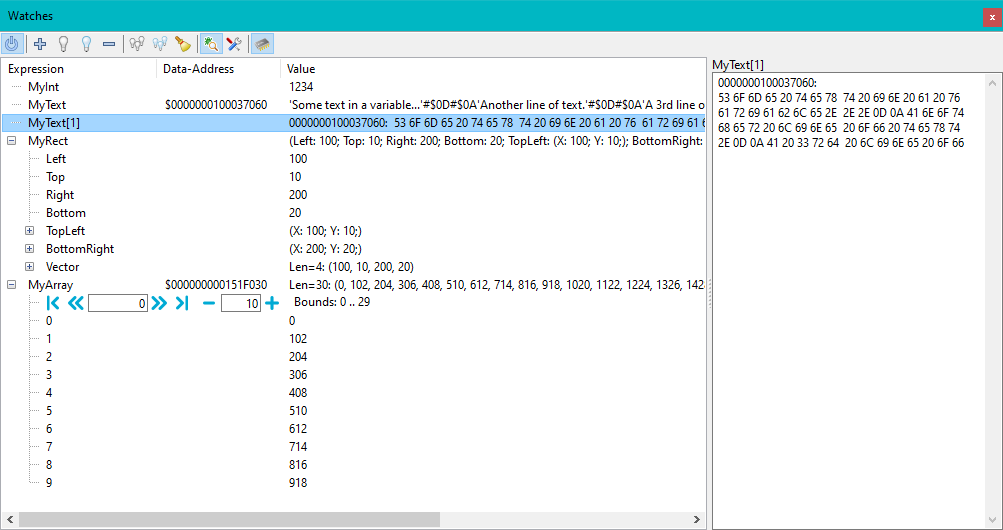
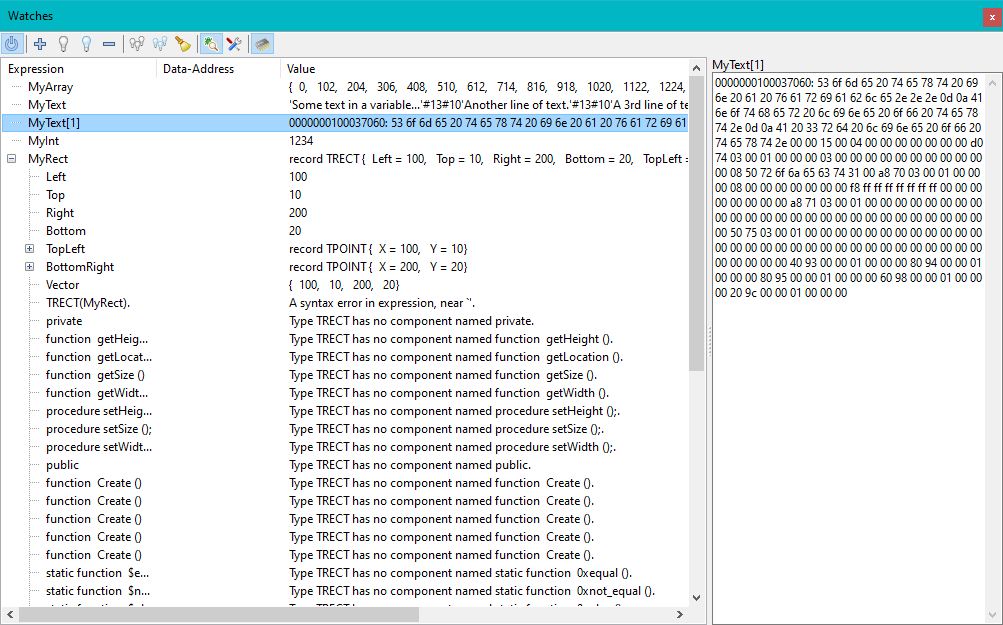
The images below show:
- The "Data-Address" column
- The "Inspect-Pane" (on the right side, showing the current watch in more detail)
(Example: Hex dump of a string) - Expanded structured values (objects, classes, records)
- Expanded arrays
First steps - Add watches
When the debugger paused your app, you can add new values to the Watches window. Either
- Select a variable in the source and press Ctrl+F5
- Add a new watch from the menu Main Menu > Run > Add Watch
- Open the Ctrl+Alt+S and press
 from the toolbar.
The new "watch" will be evaluated and the result shown.
You can also add watches before you start the debugger, or while the app is running. In this case the values will be retrieved as soon as the app gets paused.
If you step through your code or run the app to the next breakpoint all your watches will be updated each time the app pauses at the next location.
Expressions can be local or global variables, (certain) properties, or pascal expressions (limited support, e.g. "a+1"). See here for more information
Data displayed
The data is retrieved from the memory of the debugged app. The debugger then formats it according to the type or the variable.
Data is retrieved according to Pascal scoping from the current line of code. "current line" is the line at which the app is paused (or the line selected via thread and stack).
- However the debug info does not always provide all scoping info.
For global variables from other units the correct "lookup order" is not known. So if 2 units (other than the current unit) both have a variable "MyValue" (and there is no such variable in the current unit), then the debugger will display one of them, but it may not be the one the compiler would have picked. (see https://gitlab.com/freepascal.org/lazarus/lazarus/-/issues/40173) - Local variables, fields of the object, and variables in the current unit are not affected, but can be if type-casted using a global type declaration.
- This may also depend on the debugger backend, for more information see notes on each debugger backend.
Scope (Stackframe, Thread, History)
The values are evaluated according to the scope set in the Thread and Stack dialog. Default is the current Thread and top stack frame. Both (Stack and Frame) dialog offer to change the "current" Frame/Thread. The watch window will follow this selection.
It is also possible to select previously displayed values, using the History dialog.
Special Values
- <invalid>
- Value currently not available. Can be caused, if the debugger is not active or the debugged app not currently paused.
- <evaluating>
- Value is currently retrieved. A result will be show soon
- <disabled>
- The expression is excluded from evaluation. See Disable/Enable buttons (light bulbs)
- Error...
- The value could not be evaluated. (Error in Expression or Variable not available in selected scope.
Interface
Toolbar
 Power
Power- Enables/Disables all updates. This does not affect the enabled/disabled state of individual watches. This will freeze the current display.
 Add
Add- Add a new expression. This will open the Watch property dialog. (It is also possible to double click an empty line in the list)
 Enable/
 Disable
- Enables/Disables individual watches from evaluation. This can be used to prevent spending time on evaluation, if a watch is not available in the current scope.
 Remove
- Deletes the selected Watch(es)
 Enable all/
 Disable all
- Enables/Disables all watches from evaluation.
 Delete all
- Cleans the list
 Detail-Pane
- Open the detail-pane.
 Properties
- Change the expression or properties of the current/selected watch. (Also possible by double clicking the watch)
 Data-Address
- Show hide the data-address column
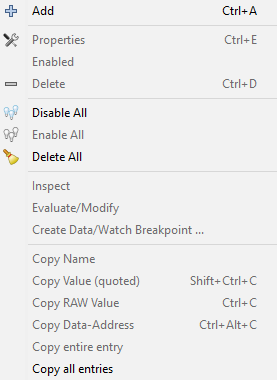
Additional to the above functionality the context menu allows to:
- Inspect
- Opens the current watch in the Debug-Inspector
- Evaluate/Modify
- Opens the current watch in the Evaluate/Modify window
- Create Data/Watch Breakpoint
- Opens the dialog to create a new watchpoint based on the current watch (stop if wachted value is changed or accessed)
- Copy Name
- Copies the expression to the clipboard
- Copy Value (quoted)
- Copies the value to the clipboard (strings will be quoted, so they can be pasted into pascal code)
- Copy RAW Value
- Copies the value to the clipboard (strings will not be quoted, so they have actual tabs,cr,lf when being pasted)
- Copy Data Address
- Copy the data address, if available
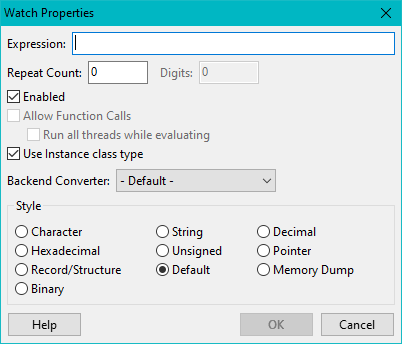
Watch Properties
Entries can be double-clicked to edit them.
- Expression
- An expression for which the evaluated value should be shown. Expressions can be local or global variables, (certain) properties, or pascal expressions (limited support, e.g. "a+1").
- Repeat Count
- Can be used to get array slices. The watch specifies the first element of the array "A[7]" (must have an index). With a "Repeat count" of 20, this shows A[7] to A[26]. It can also be used with a dynamic array (no index given). Then it specifies haw many elements to show, beginning with Item[0].
- Digits
- Not implemented.
- Enabled
- See Enable/Disable above.
- Allow function calls
- Must also be enabled in the global options and supported by the backend. FpDebug-Watches-FunctionEval
- Run all threads while evaluating
- Normally only the function will run and all threads (current and others) keep being paused. If however the function may wait for a lock hold by another thread, then it would block. This will run the function, and let the other threads run freely during that time. The current thread will be kept paused (it runs the function).
- Use Instance class type
- Objects are normally shown according to the declaration of the watched expression. Watching "Sender: TObject" will only show you data that is declared on TObject. However object variables can contain objects of inherited classes. Sender may be a TForm. Using this the debugger will find the actual class of the object and display all data.
- Converter
- IDE_Window:_Ide_Options_-_Backend_Value_Converter
- Style
- How to display the data. If a style can not be applied, default will be used.
See also
- Setup the debugger
- Watch-Points (Data-Breakpoints)
- Evaluate Window
- Debug Inspector
- Debug History


